Versions Compared

Key

  • This line was added.
  • This line was removed.
  • Formatting was changed.

...

Table of Contents
stylenone

Click to start

OnDemand interactive applications can be launched from OnDemand with graphics, similar to a remote desktop that only launches the application.

After logging into OnDemand on your favorite ARCC HPC resource, you can request a Jupyter Session by clicking on the app from the main Dashboard:

...

Fill out the Jupyter Session Request Form

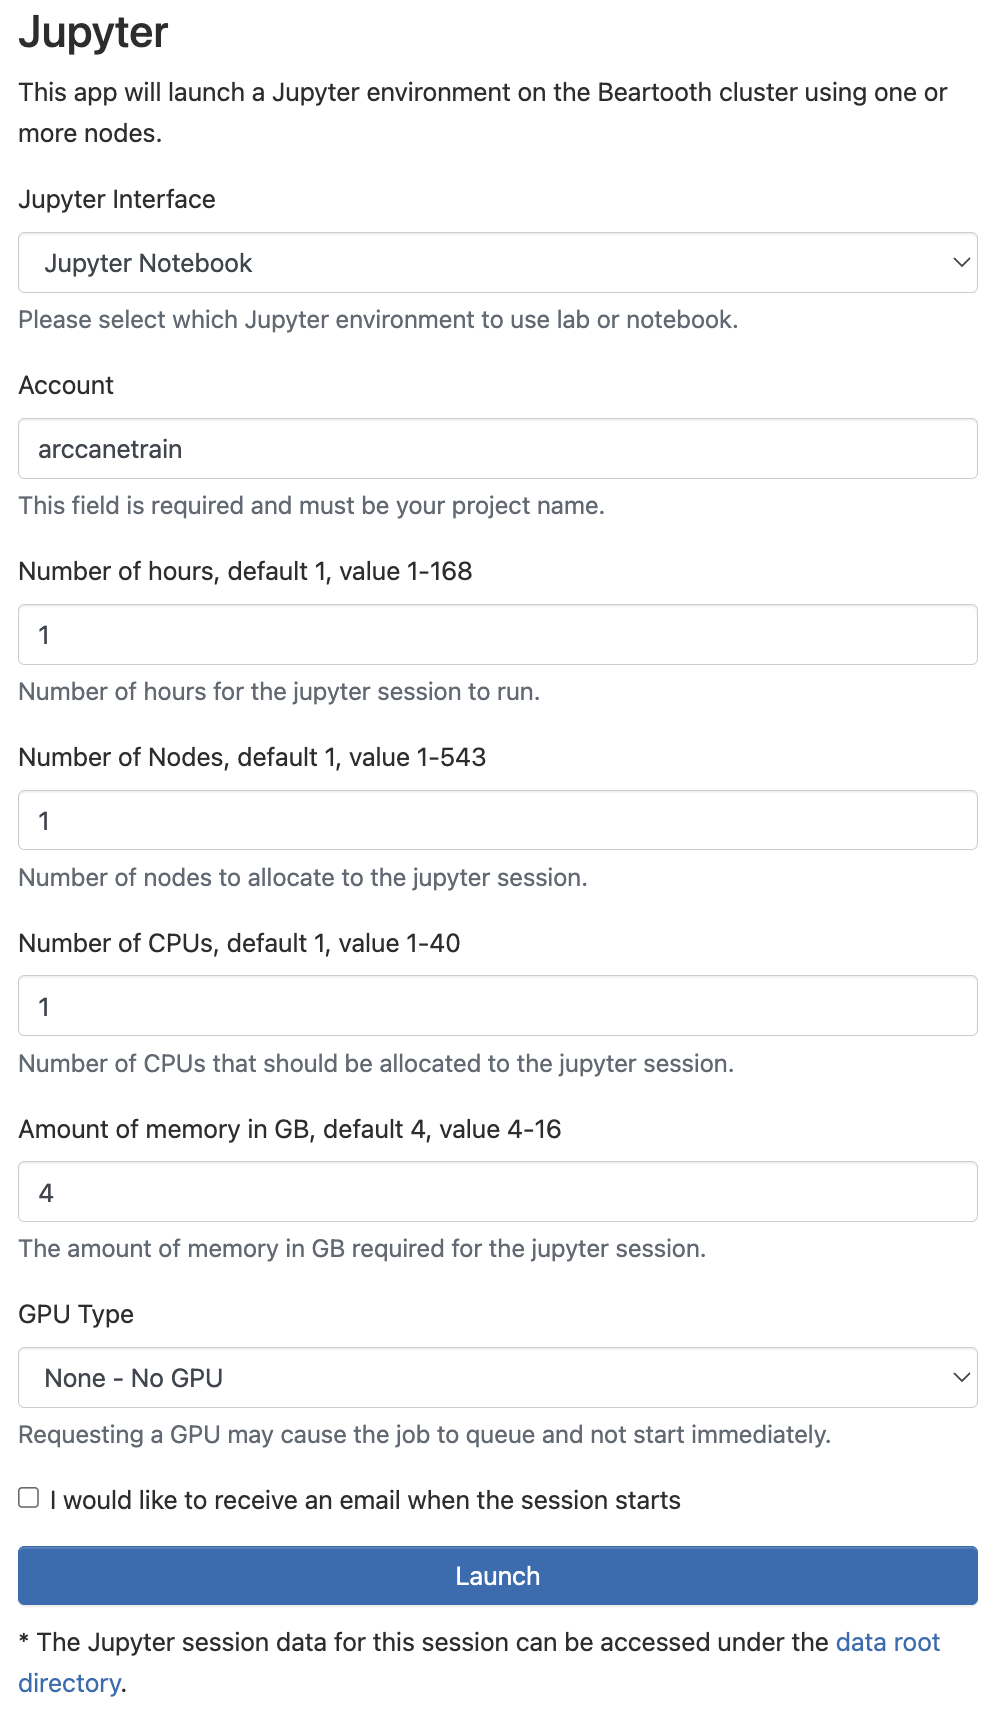
After clicking the jupyter app, you are taken to a web form to tailor and specify the Jupyter environment you’d like to run in your session

Jupyter Interface: Select from Jupyter Notebook or Jupyter Lab

Account: The associated investment account or project you’re using to run the session

Number of hours: How long you plan to use the notebook

Number of Nodes: how many nodes you want allocated to perform work while using this notebook.

Number of CPUs: how many cores you will need access to perform your work while using this notebook.

Amount of Memory: Memory in GB required to run throughout the course of this Jupyer session

GPU Type: Which GPU hardware you’d like to perform your work in the Jupyter Notebook or Lab on

...

A screenshot of a computer

Description automatically generatedImage Removed

Your interactive sessions

...

  • When you click launch, you’re redirected to a page showing a list of your most recent interactive sessions.

  • The Slurm scheduler assigns a compute node with a specified number of cores, memory, hardware and timeframes as requested from the input you provided in your webform.

  • When your session is ready for use, the heading will turn green.

    • Completed sessions are denoted with gray headings

    • Pending sessions are denoted with blue headings

...

.

...

Connect to your session

...

To open Jupyter, click on the connect button within the active session

...

You will be directed to a Jupyter notebook or lab environment to start using Jupyter!

...

Introduction to Jupyter


...

Initial Screen Navigation and Options

Upon connecting, you are presented with the main Jupyter Labs screen and options:

  • Drop down menu bar along the top

  • Along the left is a collapsable sidebar

  • Along the right is another sidebar

  • Main work area in the center (Starts with Launcher tab opened)

  • Along bottom is a information dock

Image Added

...

Drop-Down Menu Bar

Has top-level menus that expose actions available in JupyterLab with their keyboard shortcuts. The default menus are:

  • File: actions related to files and folders

  • Edit: actions related to editing documents and other activities

  • View: actions that alter the appearance of JupyterLab

  • Run: actions for running code in different activities such as notebooks and code consoles

  • Kernel: actions for managing kernels, which are separate processes for running code

  • Tabs: a list of the open documents and activities in the dock panel

  • Settings: common settings and an advanced settings editor

  • Help: a list of JupyterLab and kernel help links

JupyterLab extensions can also create new top-level menus in the menu bar.

dropdownmenu.pngImage Added

...

Left Sidebar

Left Sidebar will have a number of default options upon launch.

  • File Browser:

    • Shown with Image Added icon

  • Run Manager:

    • Shown with Image Added icon.

    • Contains a list of tabs in the main work and of running kernels and terminals

  • Table of contents

    • Shown with Image Added icon.

  • Extension manager

    • Shown with Image Added icon.

  • Older versions may show a Command palette:

    • Shown with Image Added icon.

    • provides an easy search and run for JupyterLab commands

    • Newer versions can access this from the View drop-down option or using the keyboard shortcut Command/Ctrl Shift C.

leftsidebar.pngImage Added

...

Right Sidebar

Property inspector (active in notebooks)

  • Gears iconImage Added

  • Allows users to inspect properties of output and items from code or main work area

Image Added

Debugger

  • Bug icon Image Added

  • Helpful when debugging code and viewing dependent functions and variables within your code

Image Added

...

Main Work Area

  • Upon initial login, the main work area will show the JupyterLab Launcher in a tab.

  • Users can launch lab applications in a new tab from the Launcher

    • Any kernels available on the cluster will show up as a kernel option in the launcher (Usually launchable as both a Notebook or Console)

    • Additional lab applications like terminal, file editors, and help menus will show up as options below under ‘Other’

  • The main work area in JupyterLab allows users to arrange documents (notebooks, text files, etc.) and other activities (terminals, code consoles, etc.) into panels of tabs.

    • Tabs can be resized or subdivided.

    • Move a tab to a panel by dragging the tab to the center of a tab panel.

    • Subdivide a tab panel by dragging a tab to the left, right, top, or bottom of the panel.

mainworkarea.pngImage Added

...

Information Dock

Found along the bottom of your Jupyter Lab window, the information dock contains a few informative displays that are always visible throughout your JupyterLab Session

bottominfodock.pngImage Added

View Toggle (Toggling simple “on” removes tabs for just one main/active work area. This makes it look more like a traditional Jupyter Notebook)

Image Added

Active Count

  • # of active kernels Image Added

  • # of active terminals Image Added

Image Added

Active work area:

  • Current mode in your highlighted working area

  • Location within the active file

  • Active file name

Image Added

Notifications: Notifies users of possible updates or other JupyterLab news

Image Added

...

Running a Console Kernel

...

Dive into Jupyter Notebooks


Loading User Defined Kernels from Conda Env